Business process optimisation: a practical guide for professionals


Business process optimisation (BPO) is the practice of analysing and improving repeatable workflows to raise speed, quality, and cost-efficiency across an organisation. It draws on structured frameworks like DMAIC, Six Sigma, and Lean, and increasingly relies on technologies such as process mining and robotic process automation (RPA) to surface and remove inefficiencies. Operations managers, finance teams, customer service leads, IT departments, and executives all benefit directly. The outcomes are concrete: faster cycle times, fewer errors, lower operating costs, and stronger compliance. If you run a process more than a few times a week, it is almost certainly a candidate for improvement.
Table of Contents
- Why business process optimisation matters for your bottom line
- Which frameworks should you use, and when?
- How to apply DMAIC step by step on your first project
- Which tools accelerate each stage of optimisation?
- What KPIs should you track, and how do you calculate ROI?
- Common pitfalls and how to keep your gains from slipping away
- What does process optimisation look like in practice? An invoice-to-pay example
- How Tech Business Development approaches process optimisation
- Key takeaways
- Why Canadian businesses should think about this differently
- Cut operational costs faster with Tech Business Development
- Further reading and authoritative sources
Why business process optimisation matters for your bottom line
The business case for investing in process improvement is not subtle. 83% of business leaders say process optimisation is their most effective tool for driving value, and 82% specifically prioritise it for cost-cutting and cash-flow management during periods of economic instability. Those are not aspirational figures — they reflect how leaders actually allocate attention when margins tighten.
The core benefits decision-makers care about:
- Cost reduction: eliminating redundant steps and manual handoffs cuts labour and overhead costs, often by a material amount.
- Speed: shorter cycle times mean faster delivery to customers and quicker cash conversion.
- Quality: fewer defects and rework incidents reduce the cost of poor quality and protect your reputation.
- Compliance: documented, controlled processes make audits and regulatory reporting far less painful.
- Employee experience: removing repetitive, low-value tasks frees staff to focus on work that actually requires judgement.
- Customer satisfaction: faster, more consistent service directly improves the experience your customers have with your brand.
Beyond cost, optimisation supports cash-flow resilience. When a process is well-mapped and monitored, you can spot a slowdown in invoice approvals or a spike in order errors before it becomes a cash-flow problem. That early-warning capability is worth as much as the direct savings, particularly for Canadian businesses navigating supply-chain variability and shifting interest rates.
Disciplined improvement efforts are also producing more consistent results over time. 79% of operating-model redesigns were completed successfully in 2025, up from 51% in 2014. The gap between those two numbers reflects what happens when organisations move from ad-hoc fixes to repeatable methodology.
Which frameworks should you use, and when?
Five methodologies dominate the field. Each suits a different situation, and picking the wrong one wastes time.
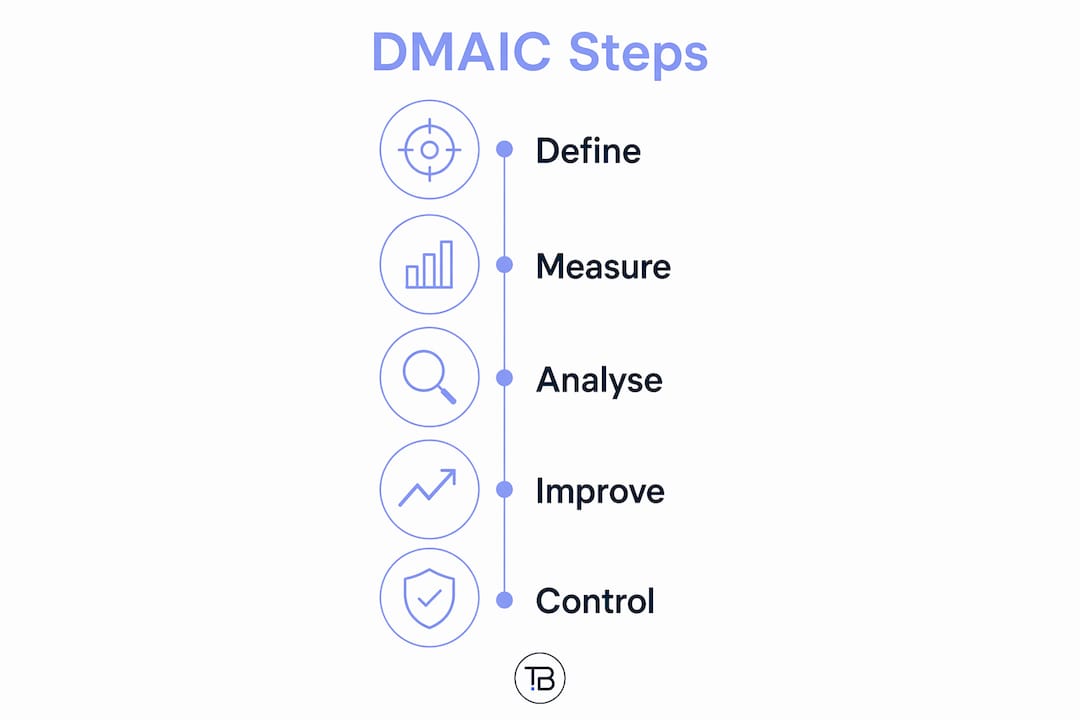
- DMAIC (Define, Measure, Analyse, Improve, Control): the structured, data-driven path for improving an existing process. Best when you have baseline data and want measurable, repeatable gains.
- Lean: focuses on eliminating waste (non-value-adding steps) from a process. Works well in manufacturing, logistics, and service delivery where flow and speed matter most.
- Six Sigma: a statistical approach targeting near-perfect quality. Six Sigma aims for 3.4 defects per million opportunities (DPMO), making it the right choice when defect cost is high and data is available.
- Kaizen: continuous, incremental improvement driven by frontline teams. Low-risk, high-engagement, and ideal for building an improvement culture over time.
- BPR (Business Process Reengineering): a radical, top-down redesign of core processes. Reserve it for situations where incremental improvement cannot close the gap — a full redesign carries significant risk and disruption.
BPO versus BPM: Business process management (BPM) is the broader discipline covering the entire lifecycle of every process in an organisation. Business process optimisation sits inside BPM as the targeted activity of improving specific workflows. Use BPO when you need concrete gains within existing processes; use BPM when you need enterprise-wide governance and visibility.
| Dimension | DMAIC / Six Sigma | Lean | Kaizen | BPR |
|---|---|---|---|---|
| Scope | Single process or value stream | End-to-end flow | Team-level tasks | Entire business process |
| Pace | Weeks to months | Weeks | Ongoing | Months to years |
| Data needs | High (statistical) | Moderate | Low | High |
| Best for | Defect and variance reduction | Waste and speed | Culture and engagement | Radical redesign |
Choosing between them comes down to four factors: how complex the process is, your organisation’s tolerance for disruption, how much baseline data you have, and how quickly you need results. A small accounts-payable team with limited data is better served by Lean or Kaizen than by a full Six Sigma project. A high-volume, high-defect manufacturing line is exactly where DMAIC earns its keep.
How to apply DMAIC step by step on your first project
DMAIC is the recommended structured path for most optimisation projects because it forces you to measure before you change anything, which is the single most common mistake teams skip.
1. Define Scope the project clearly: what process are you improving, what does success look like, and who are the stakeholders? Produce a project charter with a problem statement, goal, scope boundaries, and a named process owner. Keep the scope tight. A first project that covers one subprocess end-to-end beats an ambitious project that stalls because it touches too many teams.
2. Measure Map the current-state process in detail, then collect baseline metrics: cycle time, error rate, cost per transaction, and throughput. Process mining tools can pull this data directly from your systems; manual time-stamping works for smaller operations. The deliverable is a baseline data set and a current-state process map. This phase typically takes two to four weeks for a mid-sized process.

3. Analyse Identify root causes of the gaps between current performance and your goal. Use fishbone diagrams, Pareto charts, or value-stream mapping to distinguish symptoms from causes. Mapping workflows reveals the repetitive tasks, handoff delays, and decision points that are prime candidates for automation or redesign. The deliverable is a prioritised list of root causes with supporting data.
4. Improve Design the future-state process. This is where you introduce automation candidates, eliminate redundant steps, and standardise handoffs. Run a pilot on a limited scope before full rollout. A business automation setup checklist helps ensure you have covered the technical and operational requirements before going live. The deliverable is a tested, documented future-state process.
5. Control Put monitoring in place so the gains hold. Assign a process owner, set up dashboards or automated alerts for key metrics, and schedule periodic reviews. Automated reporting makes this phase far less manual. The deliverable is a governance plan with escalation paths and a documented control chart.
Timeline and cost considerations: a small process (one team, low data complexity) typically runs four to eight weeks and requires minimal external spend. A medium process (cross-functional, moderate data needs) runs eight to sixteen weeks. A large or enterprise process can take six months or more and usually warrants external facilitation. For Canadian small businesses, starting with a single, well-scoped subprocess keeps cost and risk low while building internal capability.
Pro Tip: Engage frontline staff in the Measure and Analyse phases. They know where the process actually breaks — not where the flowchart says it should.
Which tools accelerate each stage of optimisation?
Technology does not replace the methodology, but it compresses the time each phase takes. The key is matching the tool category to the DMAIC stage where it adds the most value.
Measure and Analyse: process mining and task mining Process mining tools extract event logs from your existing systems (ERP, CRM, HRIS) and reconstruct the actual flow of work, including every deviation and delay. Data visibility is the most common hurdle in optimisation projects, and process mining addresses it directly by revealing the true “as-is” process that manual maps routinely miss. Task mining goes one level deeper, capturing how individual users interact with desktop applications to find micro-inefficiencies.
Improve: RPA and workflow automation Robotic process automation handles high-volume, rule-based tasks: data entry, invoice matching, report generation, and similar work. For Canadian businesses, time-saving office automation is often the fastest path to a measurable quick win. Workflow platforms connect systems and people through structured routing, approvals, and notifications, replacing email chains and spreadsheet trackers.
Control: BI dashboards and automated alerts Business intelligence tools turn process data into live dashboards that process owners can monitor without pulling manual reports. Connecting your marketing analytics workflow or operational data to a BI layer means exceptions surface automatically rather than waiting for a monthly review.
Selection criteria for Canadian organisations:
- Data access: can the tool connect to your existing systems without a major integration project?
- Security and data residency: Canadian organisations subject to PIPEDA or provincial privacy legislation (notably Quebec’s Law 25) should confirm that data processed or stored by the tool remains in Canada or in a jurisdiction with equivalent protections.
- Scalability: does the tool grow with your process volume, or does it hit a ceiling at mid-market scale?
- Vendor lock-in risk: prefer platforms with open APIs and standard data exports. Reviewing workflow management system examples before committing to a platform helps you compare options on neutral ground.
- Cost: cloud-based tools with per-user or consumption pricing are usually the most accessible entry point for smaller Canadian businesses.
What KPIs should you track, and how do you calculate ROI?
Measuring improvement requires a before-and-after comparison on metrics that are directly tied to the process you changed. The following KPIs cover most optimisation projects:
| KPI | Formula | Why it matters |
|---|---|---|
| Cycle time | End time minus start time per transaction | Measures end-to-end speed |
| Throughput | Transactions completed per period | Tracks capacity and volume |
| Error / defect rate | Errors ÷ total transactions × 100 | Quantifies quality |
| First-pass yield | Transactions completed correctly first time ÷ total × 100 | Reveals rework burden |
| Cost per transaction | Total process cost ÷ transaction volume | Converts efficiency to dollars |
| Lead time | Time from request to delivery | Customer-facing speed metric |
| Customer satisfaction | CSAT or NPS score | Links process quality to experience |
Simple ROI calculation: if your invoice approval process currently costs $18 per invoice (labour, rework, delays) and the improved process costs $9, and you process 500 invoices per month, the monthly saving is $4,500. Annualised, that is $54,000. Set that against the cost of the improvement project to get your payback period.
Measurement cadence matters as much as the metrics themselves. Track KPIs weekly during the first 90 days after a change, then shift to monthly once the process has stabilised. Assign a named owner for each metric, not just a team, so accountability is clear. The role of data in cost reduction is most visible when you can show a clean before-and-after trend line to leadership.
Common pitfalls and how to keep your gains from slipping away
Most optimisation projects that fail do not fail in the Improve phase. They fail in the Control phase, when attention moves to the next initiative and the process quietly drifts back to its old state.
Common pitfalls:
- Automating a broken process: automating a broken process accelerates waste rather than removing it. Map and clean the process manually before any automation work begins.
- Insufficient data visibility: if you cannot measure the current state, you cannot prove improvement. Invest in baseline measurement before designing solutions.
- Weak stakeholder buy-in: a process change that frontline staff work around is not an improvement. Involve the people who run the process in the design, not just the review.
- No process owner: without a named owner, no one escalates when metrics drift. Every process needs a single accountable person.
- Skipping documentation: undocumented changes are invisible to new staff and auditors. Version-controlled process maps are not optional.
Governance checklist:
- Named process owner with authority to enforce the standard
- Version-controlled process map stored in a shared, accessible location
- Monitoring cadence defined (weekly, monthly, quarterly)
- Escalation path documented: who gets notified when a KPI breaches its threshold
- Training plan for new staff joining the process
- Scheduled periodic review (at minimum, annually)
Pro Tip: The earliest sign of process drift is usually a rise in workarounds, not a drop in KPIs. Ask frontline staff monthly whether they are following the documented process or have found a “better” way. Their answer tells you more than the dashboard.
Change management is not a soft add-on. A communication plan that explains why the change is happening, what it means for each role, and how feedback will be handled is the difference between a process that sticks and one that reverts within six months.
What does process optimisation look like in practice? An invoice-to-pay example
The situation: a mid-sized Canadian distributor processes roughly 600 supplier invoices per month. The finance team is handling approvals manually via email, matching invoices to purchase orders in a spreadsheet, and chasing down approvals from three department heads. Average invoice cycle time is 14 days. The error rate (mismatches, duplicate entries, missing PO references) runs at about 12%. Cost per invoice, including labour and rework, sits at approximately $22.
What they did (DMAIC in brief):
- Define: scoped the project to the invoice receipt-to-payment-approval subprocess. Goal: cut cycle time to under five days and error rate below 3%.
- Measure: mapped every step and touchpoint, then pulled three months of invoice data to establish baseline metrics.
- Analyse: found that 70% of delays came from two sources: waiting for department-head approval (average 4.5 days) and manual PO matching (average 2 days).
- Improve: introduced a structured digital approval routing workflow, standardised the invoice submission format with vendors, and automated PO matching using a rules-based tool.
- Control: set up a weekly dashboard tracking cycle time, error rate, and cost per invoice. Named one finance team member as process owner.
Before and after:
| Metric | Before | After |
|---|---|---|
| Average cycle time | 14 days | 4 days |
| Error / mismatch rate | 12% | — |
| Cost per invoice | ~$22 | ~$10 |
Three things you can do in your own invoice-to-pay process this week:
- Standardise the invoice format you accept from vendors (a single template eliminates most matching errors).
- Map every approval step and identify which ones could be handled by a rule rather than a person.
- Set a cycle-time target and start measuring it now, even manually, so you have a baseline before you change anything.
How Tech Business Development approaches process optimisation
Tech Business Development works with Canadian businesses to move from process pain points to measurable, sustained improvement. The engagement typically starts with a scoping conversation to identify which processes are costing the most time or money, followed by a structured process-mapping exercise that surfaces the root causes rather than just the symptoms.
From there, the team builds and deploys tailored workflow automation, connects data sources to live reporting dashboards, and puts governance structures in place so the gains hold after the project closes. Services span the full DMAIC lifecycle: process mapping and baseline measurement, automation build (RPA and workflow platforms), BI and reporting setup, and control-phase governance documentation.
Expected outcomes for clients include significant reductions in manual task volume and operational costs of up to 50%, alongside real-time visibility into the metrics that matter. For Canadian organisations navigating PIPEDA compliance or Quebec’s Law 25, Tech Business Development handles data residency and security requirements as part of the engagement, not as an afterthought.
To learn more about how IT operational costs can be reduced through structured workflow optimisation, or to request a scoping conversation, visit Tech Business Development.
Key takeaways
Business process optimisation delivers measurable gains in speed, quality, and cost only when it combines a structured methodology like DMAIC with clear ownership, baseline measurement, and a governance plan that prevents process drift.
| Point | Details |
|---|---|
| Start with measurement | Establish baseline metrics before changing anything — no baseline means no proof of improvement. |
| Match method to context | Use DMAIC for data-rich projects, Lean for waste reduction, Kaizen for culture-building, and BPR only when incremental change is not enough. |
| Automate after fixing | Map and clean the process manually first; automating a broken process accelerates waste, not efficiency. |
| Govern for the long term | Assign a named process owner, version-control your process maps, and monitor KPIs weekly for the first 90 days. |
| Tech Business Development | Offers end-to-end optimisation services for Canadian businesses, from process mapping to automation build and governance, with operational cost reductions of up to 50%. |
Why Canadian businesses should think about this differently
Most optimisation guides treat the methodology as the hard part and governance as the easy part. In practice, it is the reverse. Getting a team to run a DMAIC project is straightforward once you have a facilitator and a scoped problem. Getting that team to maintain the improved process six months later, when attention has moved on and the original pain is no longer fresh, is where most gains evaporate.
For Canadian organisations specifically, there are three constraints that shape how optimisation projects should be sequenced. First, data residency obligations under PIPEDA and Quebec’s Law 25 mean that tool selection cannot be separated from compliance review — a process mining platform that stores event logs on US servers may create a legal exposure that offsets the operational gain. Second, Canadian businesses outside major urban centres often have smaller internal teams, which means the governance model needs to be lighter and more automated than what a large enterprise would deploy. Third, the cost of external facilitation is real, and the ROI calculation needs to account for it honestly.
The practical implication: start with a single, high-visibility process that has a clear owner and enough transaction volume to produce meaningful data within four to six weeks. A quick win in that process builds the internal credibility and the data literacy that makes the second and third projects faster. Chasing enterprise-wide transformation on the first attempt is how optimisation programmes stall before they prove their value.
Three priorities for Canadian businesses in the first 90 days: get visibility into your actual process data (not your assumed process), pick one process with a named owner and a measurable baseline, and put a simple control mechanism in place before you call the project done. The methodology is well-established. The discipline to follow through on the Control phase is what separates organisations that sustain their gains from those that repeat the same improvement project two years later.
Cut operational costs faster with Tech Business Development
Cutting manual work and reducing operational costs by up to 50% is the concrete outcome Tech Business Development delivers for Canadian businesses through structured process optimisation and workflow automation. Where a traditional consulting engagement might take months to produce a recommendation, Tech Business Development moves directly from a scoping audit to a working automation pilot, giving you a measurable result before a large commitment is required.

The engagement starts with a rapid process audit that identifies your highest-cost inefficiencies and maps them to automation or workflow solutions. From there, the team builds the solution, connects it to your reporting layer, and hands over a governance plan so the gains hold. Whether you need expert IT and automation services for a single subprocess or a broader operational overhaul, the process is designed to be low-friction and results-focused from day one.
Book a scoping conversation at techbusinessdevelopment.com to get a clear picture of where your biggest process costs are and what it would take to address them.
Further reading and authoritative sources
- DMAIC — ASQ: the canonical reference for the Define, Measure, Analyse, Improve, Control framework, including phase-by-phase guidance and templates.
- Six Sigma — ASQ: authoritative primer on Six Sigma methodology, the 3.4 DPMO target, and how DMAIC fits within it.
- What is process optimisation? — IBM: clear explanation of how automation and AI integrate with structured optimisation methods.
- Business process improvements — NetSuite: practical BPI guide with the 2025 Celonis leadership survey data on optimisation priorities.
- How to improve and optimise business processes — TechTarget: step-by-step practitioner guide covering goal definition, mapping, measurement, redesign, and monitoring.
- Business process analysis — Asana: useful for understanding how to map workflows and identify automation candidates during the Analyse phase.
- Operations consulting: 10 proven methods for 2026: practical operations consulting frameworks relevant to scoping and structuring an optimisation programme.
- What is task mining — Clearwork: explains how task mining complements process mining to reveal desktop-level inefficiencies.
Recommended