Set up an automated marketing analytics workflow


An automated marketing analytics workflow is a system that automatically collects, integrates, analyses, and reports on marketing data to deliver timely insights with minimal manual effort. For small business owners and marketing teams, this is the difference between reacting to last month’s numbers and acting on yesterday’s. When you set up an automated marketing analytics workflow correctly, you connect sources like Google Ads, Meta, your CRM, and GA4 into a single reporting pipeline that runs without you touching it. The result is cleaner data, faster decisions, and a measurable improvement in marketing ROI.
What do you need before setting up your analytics workflow?
The biggest mistake teams make is reaching for tools before they understand their data. Marketing operations experts recommend defining your operational standards, including naming conventions and core KPIs, before choosing any platform. That order matters because automation reflects your strategy. If your strategy is unclear, automation just produces bad reports faster.
Data sources to connect
Your workflow needs to pull from every channel that touches a customer. The most common sources are Google Ads, Meta Ads, your CRM (such as HubSpot or Salesforce), website analytics via GA4, and email platforms. Each source speaks a different data language, which is why consistent UTM naming conventions are non-negotiable from day one.

Choosing the right technical tier
Your tool selection should match your data volume and team size. Free tools like Looker Studio suit teams managing fewer than five clients or campaigns. Mid-scale SaaS platforms handle up to 30 data sources with less manual configuration. Custom engineering solutions using APIs and tools like BigQuery work best for larger operations with complex attribution needs. Overpaying for enterprise infrastructure when you have five campaigns is a waste. Underpaying and hitting data limits at month-end is equally costly.
ScaleTool approachBest forSmall (1–5 sources)Looker Studio + GA4Solo marketers, local businessesMid (6–30 sources)SaaS connector platformsGrowing agencies, SMBsLarge (30+ sources)Custom BigQuery + APIHigh-volume teams, enterprises
A data warehouse like BigQuery acts as the central hub where all your sources land before reporting. API connectors are the pipes that move data from each platform into that hub automatically. You do not need to understand SQL deeply to get started, but you do need to know which metrics matter before you build any view.
Pro Tip: Build a one-page data dictionary before touching any tool. List every metric you plan to track, its source, and its definition. This single document prevents weeks of confusion later.
How to set up your automated marketing analytics workflow step by step
A functional marketing data warehouse with automated connectors from six to eight data sources takes approximately 5–7 hours of total setup time. BigQuery alone takes about 15 minutes to configure. Individual connectors take 2–3 minutes each. SQL views take 30–60 minutes. Dashboards take roughly one hour. That timeline is achievable for most small teams with no custom engineering.
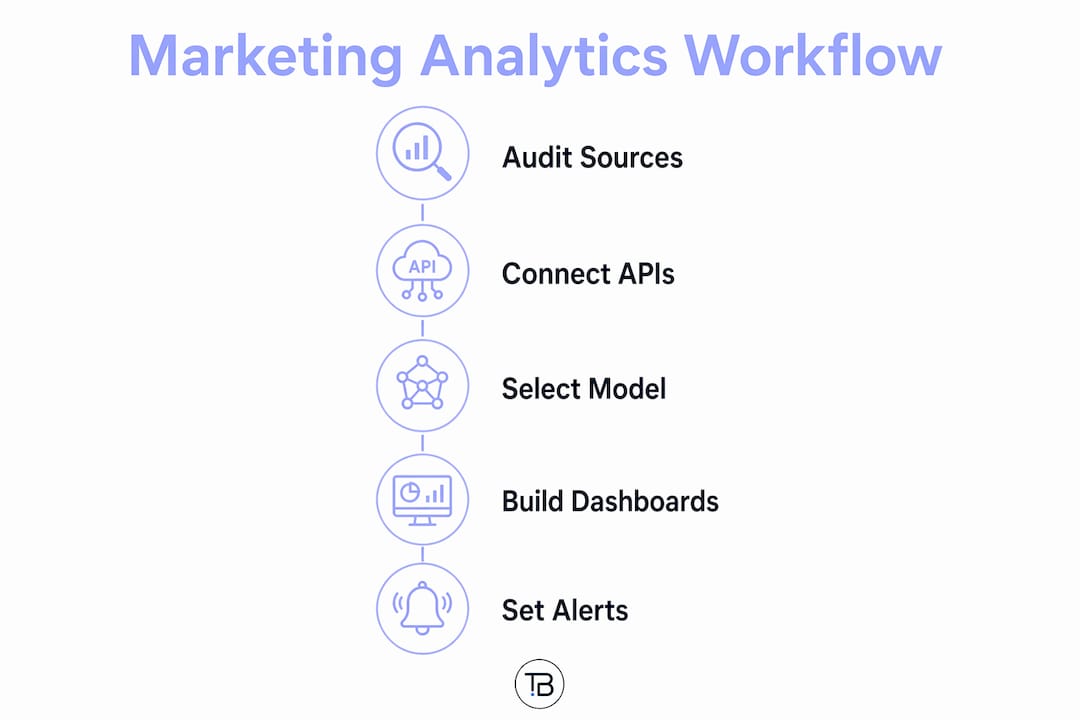
Step 1: Audit your existing data sources
List every platform generating marketing data. Note which ones have native API connections and which require manual exports. Identify gaps where data is missing entirely. This audit becomes your integration checklist.
Step 2: Connect platforms through APIs and tracking
Use API connectors to link each source to your central data warehouse. For website data, implement server-side tracking through Google Tag Manager to reduce data loss from browser restrictions. Server-side tracking captures events that client-side scripts miss, which improves attribution accuracy significantly.
Step 3: Choose and implement an attribution model
Attribution tells you which touchpoints drove a conversion. Last-click attribution is simple but misleading for multi-channel campaigns. Data-driven attribution, available in GA4, distributes credit across touchpoints based on actual conversion paths. Choose the model that reflects how your customers actually buy, not the one that makes your best channel look best.
Step 4: Build automated dashboards and reporting schedules
Connect your data warehouse to a visualisation layer like Looker Studio. Set dashboards to refresh automatically on a schedule, daily for paid media, weekly for organic and email. Automated reporting schedules mean your team opens a browser tab instead of building a spreadsheet every Monday morning.
Step 5: Configure anomaly alerts
Set threshold alerts for key metrics: cost per acquisition rising above a set value, conversion rate dropping below a baseline, or traffic spiking unexpectedly. AI agents can trigger reports on schedule and notify teams of significant KPI changes automatically. That kind of alert reduces the time between a problem appearing and a human acting on it from days to minutes.
Pro Tip: Start with three alerts maximum. One for spend, one for conversions, and one for traffic. Alert fatigue is real. Teams that receive 20 notifications a day stop reading all of them.
What common mistakes break marketing analytics automation?
Most automation failures come from teams automating a broken or undocumented manual process. Automation scales whatever exists underneath it. If your manual process is inconsistent, your automated reports will be consistently wrong.
Automation does not fix a broken process. It makes a broken process run faster and at greater scale. Map every step, every owner, and every decision point before you write a single workflow rule.
The most common mistakes, and their fixes, are:
The feedback loop point deserves emphasis. Most teams build dashboards and stop there. The real value of marketing data automation comes when insights from last week’s campaign directly shape next week’s budget allocation.
How do you scale your analytics workflow as your business grows?
Scaling an automated workflow is not about adding more tools. It is about monitoring the health of what you already have and upgrading deliberately. Track operational metrics like data refresh cycle time and report delivery reliability. If your dashboard is showing stale data or missing sources, that is a system health problem, not a reporting problem.
Pro Tip: Schedule a one-hour monthly maintenance window for your data warehouse. Review connector logs, check for failed syncs, and update any broken API credentials. One hour a month prevents a week of troubleshooting later.
For teams ready to expand beyond basic reporting, CRM workflow automations offer a practical next layer of integration that connects sales and marketing data into a single view.
Key takeaways
A well-built automated marketing analytics workflow delivers accurate, timely data by connecting the right sources, enforcing tracking standards, and closing the feedback loop between insights and campaign decisions.
PointDetailsDefine standards firstSet UTM conventions and KPIs before selecting any tool or platform.Match tools to scaleUse free tools for small setups, SaaS for mid-scale, and custom engineering for large data volumes.Map before automatingDocument every manual step and owner before building any automated workflow.Close the feedback loopUse dashboard insights to directly inform the next campaign, not just to report on the last one.Audit and maintain regularlyReview connectors, ownership, and dashboard health quarterly to prevent silent failures.
What I have learned from building these workflows for small businesses
The single most common mistake I see is teams treating automation as the goal. Automation is a means. The goal is better decisions made faster with less manual work. When a small business owner comes to me excited about a new analytics platform, my first question is always: “Can you show me your current manual process?” If they cannot, we are not ready to automate anything yet.
The teams that get the most value from automated analytics are not the ones with the most sophisticated tools. They are the ones with the clearest definitions. They know exactly what a conversion means in their business. They know which channel drives their best customers. They have agreed on what “good” looks like before they build a single dashboard. That clarity is what makes automation useful. Without it, you are just automating confusion.
The other thing I push back on consistently is the idea that AI will handle everything. AI agents handle repetitive normalisation and alerting well, but final strategic decisions must stay with a human. A system that flags a 40% drop in conversion rate is valuable. A system that automatically cuts your ad budget in response to that flag, without a human reviewing the cause, is dangerous. Keep humans in the loop for anything that costs money or changes direction.
Start with one data source, one dashboard, and one alert. Prove the value. Then expand. That approach works every time.
How Tech Business Development builds your analytics workflow
Building a reliable analytics workflow takes more than picking the right tools. It takes a clear process, the right technical tier for your scale, and someone who has done it before.
Tech Business Development builds tailored marketing analytics automation workflows for small businesses and growing teams. From GA4 and GTM setup to custom data warehouse configuration and automated reporting, the team handles the technical side so you can focus on acting on insights rather than chasing data. Whether you need a quick-start setup or a fully managed solution, explore the full services to find the right fit for your business. Reach out to Tech Business Development for an assessment and get your workflow running in days, not months.
FAQ
What is an automated marketing analytics workflow?
An automated marketing analytics workflow is a system that collects data from multiple marketing platforms, integrates it into a central location, and generates reports automatically without manual effort.
How long does it take to set up marketing analytics automation?
A functional setup with six to eight connected data sources takes approximately 5–7 hours, including warehouse configuration, connectors, SQL views, and dashboards.
What tools do I need to automate marketing analytics?
Small teams can start with GA4 and Looker Studio at no software cost. Mid-scale operations benefit from SaaS connector platforms, while large-volume teams use custom solutions built on BigQuery and API connectors.
Why does UTM tagging matter for automated workflows?
UTM tags are the foundation of attribution. Without consistent UTM naming, automated reports cannot accurately assign conversions to the correct channel or campaign, making all downstream data unreliable.
How do I know when to upgrade my analytics tools?
Upgrade your technical tier when you exceed five active data sources or clients, when your current tool hits data volume limits, or when your reporting cycle time increases noticeably due to system constraints.
Recommended