Predictive analytics in marketing for small businesses


Predictive analytics in marketing turns your existing customer data into probability scores that tell you who to contact, when, and why, before you spend a dollar. The role of predictive analytics in marketing covers four core jobs: prioritising leads by conversion likelihood, forecasting campaign response rates, flagging customers at risk of leaving, and aligning staffing or inventory with demand. MIT research links adoption to 1–3% productivity gains and up to US$918,000 higher sales at the sample mean, but only when paired with trained staff, IT infrastructure, and redesigned workflows.
For a small or local Canadian business, that translates to:
- Lower customer acquisition cost (CAC): spend budget on leads most likely to convert, not the whole list.
- Higher conversion rates: automated triggers reach the right person at the right moment.
- Retained customers: churn models flag at-risk buyers weeks before they cancel.
- Better day-to-day resourcing: demand forecasts guide staffing and stock decisions.
PIPEDA governs how you collect and use that data in Canada, and Tech Business Development helps local businesses set up the infrastructure to do it right.
Table of Contents
- What role does predictive analytics play in your marketing?
- Why does predictive analytics matter? Evidence and realistic ROI
- What data do you need, and what does PIPEDA require?
- A 6-step roadmap to get predictive analytics running
- DIY, SaaS, or managed service — which approach fits you?
- Common pitfalls and how to avoid them
- What to measure and three quick tests to validate results
- Key takeaways
- The gap between what predictive analytics promises and what actually works
- What Tech Business Development offers for a managed pilot
- Useful sources
What role does predictive analytics play in your marketing?
Six use cases deliver the clearest payoff for small and local businesses:
Predictive lead scoring. A model trained on your CRM history ranks every new enquiry by conversion probability. Sales focuses on the top tier; marketing nurtures the rest. Outcome: fewer wasted calls, shorter sales cycles.
Campaign response forecasting. Before you commit budget, a model estimates which audience segments will respond to a given offer. Outcome: reallocate spend toward high-probability segments before the campaign runs.
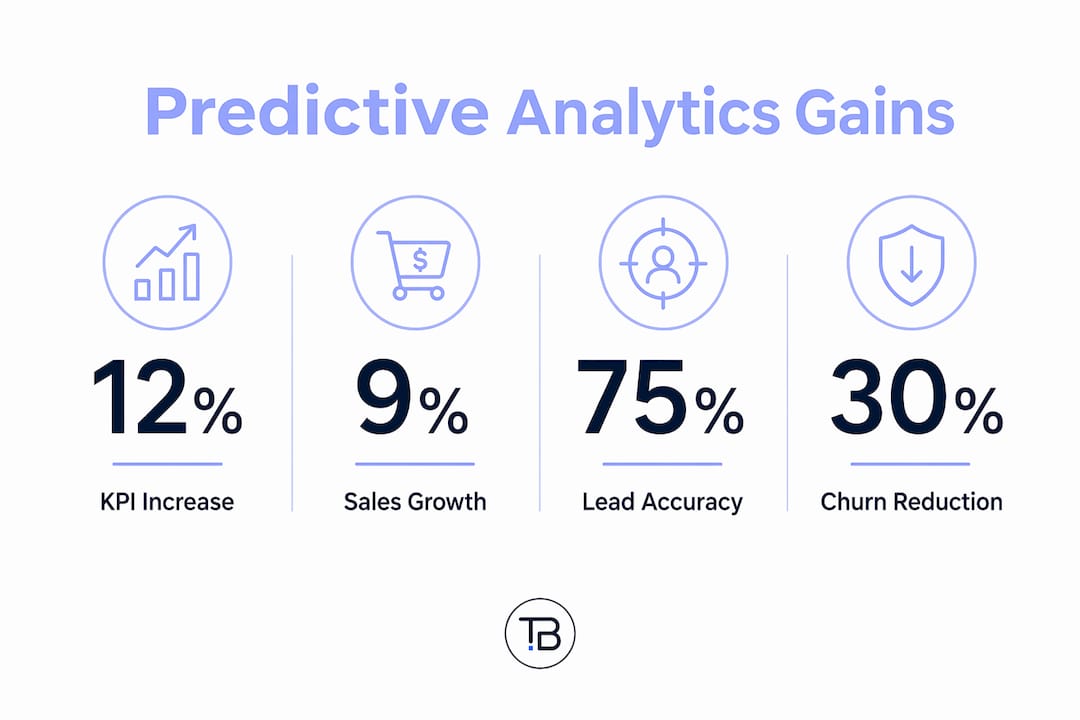
Churn prediction and retention triggers. Patterns in purchase frequency, email opens, and support tickets signal disengagement weeks early. An automated offer goes out while the customer is still reachable. A well-known example: Sprint used churn prediction tools to cut churn by 10% and drive a significant increase in upgrades within 90 days.
CLV-based acquisition budgeting. Forecast a new customer’s lifetime value at the moment of acquisition, then bid accordingly. Outcome: stop overpaying for one-time buyers; invest more in audiences that look like your best customers.
Next-best-action for personalised outreach. The model recommends the next offer, channel, or message for each contact. A local clinic, for example, can send appointment reminders timed to each patient’s typical booking gap. Outcome: higher engagement, fewer no-shows.

Local ad timing optimisation. Tools like HubSpot Marketing Hub analyse historical engagement data to suggest the best posting and send times by channel. Outcome: same ad budget, better placement timing, measurable lift in click-through rates.
Why does predictive analytics matter? Evidence and realistic ROI
The MIT study is the most rigorous large-scale evidence available. It surveyed over 30,000 manufacturing establishments and found a causal link between predictive analytics adoption and higher productivity, not just a correlation.
| Metric | Finding | Source |
|---|---|---|
| Productivity gain (average) | 1–3% | MIT |
| Sales uplift at sample mean | Up to US$918,000 | MIT |
| Primary KPI gain when integrated end-to-end | ~9–12% median | DOI review |
| Orders influenced over time | Grew significantly with sustained use | Salesforce practitioners |
The key condition: gains appear only when predictive analytics is combined with at least one workplace complement — IT capital, educated staff, or processes redesigned for efficiency.
A review of empirical studies across retail, finance, and logistics found median KPI gains of roughly 9–12% when predictions are embedded into decision systems rather than left as reports nobody acts on. Salesforce practitioners reported that predictive intelligence influence on orders grew significantly after longer usage periods, illustrating that model accuracy improves with continuous use.
Pecan.ai practitioners put it plainly: predictive analytics replaces weekly gut-feel bets with probability scores that have a track record. You are not chasing magic; you are making the guesses you were already making, but with your own data behind them.
What data do you need, and what does PIPEDA require?
Common data sources for a small Canadian business:
- CRM records (contact history, deal stages, close/lost outcomes)
- Google Analytics 4 page events and conversion paths
- POS or e-commerce transaction history
- Bookings and reservations data
- Loyalty programme activity
- Support tickets and chat logs
- Email engagement (opens, clicks, unsubscribes)
The minimum viable dataset is roughly 12 months of labelled historical outcomes, consistent customer identifiers across systems, and enough volume to find patterns (a few hundred completed outcomes is a reasonable floor for a first model).
Canada-specific privacy basics under PIPEDA:
- Collect only the data you need for the stated purpose (data minimisation).
- Obtain clear, documented consent before using personal data for predictive modelling.
- Store personal data on Canadian servers where possible, or confirm your vendor’s data-residency policy.
- Use hashed or anonymised identifiers when sharing data with third-party tools.
- Log consent records so you can demonstrate compliance if asked.
Pro Tip: Start with first-party data you already own — your CRM, GA4, and POS — before connecting any third-party enrichment. It is cheaper, lower-risk under PIPEDA, and usually sufficient for a first pilot.
A 6-step roadmap to get predictive analytics running
-
Pick one high-impact use case (1–2 days). Choose the problem where a better prediction changes a real decision next quarter: lead scoring if your sales team is overwhelmed, churn prediction if retention is the concern. Define the outcome label clearly (“converted within 90 days: yes/no”).
-
Inventory and clean your data (1–3 weeks). Audit CRM completeness, reconcile customer IDs across POS and GA4, and label historical outcomes. Budget for this step — it often takes longer than expected and is where most early investment goes.
-
Choose your tool or approach and connect data (1–2 weeks). Options range from DIY (GA4 + a BI tool + automation) to SaaS platforms like HubSpot or Pecan.ai, to a local managed service. See the next section for trade-offs.
-
Build a pilot model and set operating thresholds (1–2 weeks). Train on 70–80% of your labelled data, validate on the remainder. Set a conservative score threshold before going live — for example, “only act on leads scoring above 70.” Document the threshold rationale so you can audit it later.
-
Run an A/B or uplift pilot (4–6 weeks). Split your audience: one group receives model-driven outreach, the other your standard approach. Measure conversion lift, CAC, and retention rate. A holdout group is the only way to know whether the model is actually moving outcomes or just identifying customers who would have converted anyway.
-
Operationalise with automation and governance (ongoing). Connect model scores to your CRM or email platform so actions trigger automatically. Set a monthly review cadence to check for model drift. Building an automated marketing analytics workflow at this stage prevents scores from becoming shelfware.
DIY, SaaS, or managed service — which approach fits you?
| Approach | Typical cost | Speed to value | Data integration effort | Skill required | Privacy control |
|---|---|---|---|---|---|
| DIY (GA4 + BI + automation) | Low (tool subscriptions) | Slow (months) | High | High | Full |
| SaaS predictive platform | Medium (monthly fee) | Medium (weeks) | Medium | Medium | Shared |
| Local managed service | Variable (project-based) | Fast (weeks) | Low | Low | Managed |
Decision checklist:
- Data maturity low? Start with a managed service or SaaS that handles data prep.
- Budget tight? DIY with GA4 and a free BI layer costs least upfront but demands internal time.
- Need speed? A managed pilot gets you results in 4–6 weeks without hiring.
- Privacy-sensitive industry? Confirm data residency with any SaaS vendor; a local managed service keeps data in Canada by default.
HubSpot’s predictive lead scoring is a practical entry point for businesses already on its CRM — no separate data pipeline needed. Pecan.ai suits teams that want a dedicated predictive layer on top of existing tools, with plain-language model building and direct integration into Salesforce or HubSpot. For businesses that want none of the technical overhead, Tech Business Development runs managed pilots that cover GA4 setup, data connection, model build, and a results dashboard. For revenue-operations teams scaling toward B2B, Solano Advisory Group specialises in predictable revenue systems that pair well with a predictive analytics layer.
Common pitfalls and how to avoid them
Siloed data. If your CRM and POS never talk to each other, your model trains on an incomplete picture. Fix: integrate CRM and transaction data first, before building any model.
Overtrusting an immature model. A model trained on three months of data will overfit. Set conservative thresholds, treat the first 90 days as calibration, and do not automate high-stakes decisions until the model has a track record. The role of data in cost reduction matters here — a false positive that triggers an unneeded discount costs real money.
Predictions that never trigger actions. A score sitting in a spreadsheet changes nothing. Connect outputs directly to your email platform or CRM workflow on day one.
Skipping governance. Without calibration plots, threshold documentation, and a drift-review schedule, you will not know when the model stops working. Empirical reviews flag these as essential governance artefacts for auditable, resilient systems.
Undertrained staff. If the person running campaigns does not understand what a probability score means, they will either ignore it or over-rely on it. A one-hour onboarding session on score interpretation pays for itself quickly.
Quick pre-pilot checklist: data sources identified and connected ✓ | outcome label defined ✓ | threshold set and documented ✓ | holdout group planned ✓ | staff briefed ✓
What to measure and three quick tests to validate results
KPIs that matter:
- Conversion rate lift (model-driven group vs. control)
- CAC reduction
- Customer lifetime value (CLTV) change over 6–12 months
- Retention rate and churn rate
- Incremental revenue attributed to model-triggered actions
- False positive cost (discounts or calls wasted on non-converters)
A model that predicts accurately but does not lift outcomes may simply be identifying customers who would have converted anyway. Incrementality testing is the only way to separate genuine lift from selection bias.
Three lightweight experiments:
-
Predictive lead-scoring A/B test. Split new leads randomly: sales works the top-scored half first, the rest in standard order. Measure close rate and time-to-close after 30 days. Minimum sample: 50 leads per group.
-
Churn intervention uplift test. Flag high-risk customers with the model; randomly assign half to a retention offer, half to no contact. Compare 60-day retention rates. Minimum sample: 40 customers per group.
-
Campaign-budget reallocation trial. Shift 20% of a campaign budget toward the model’s top-predicted segment; hold the remaining 80% at standard allocation. Compare cost-per-acquisition after the campaign closes.
Treat the first test as calibration. A churn model might perform well for your highest-value customers and poorly for occasional buyers — that gap tells you where to refine next.
Key takeaways
Predictive analytics in marketing delivers measurable gains for small businesses only when predictions connect directly to automated actions, trained staff, and clean, unified data.
| Point | Details |
|---|---|
| Start with one use case | Lead scoring or churn prediction gives the fastest, clearest ROI for most small businesses. |
| Data quality gates everything | Twelve months of labelled outcomes and unified customer IDs are the minimum viable input. |
| MIT evidence is conditional | The 1–3% productivity gain requires IT infrastructure, trained staff, or redesigned workflows. |
| Measure lift, not just accuracy | Run a holdout group; a model that predicts well but does not lift outcomes adds no business value. |
| Tech Business Development | Offers managed pilots covering GA4 setup, model build, and a results dashboard for local Canadian businesses. |
The gap between what predictive analytics promises and what actually works
Most small businesses that try predictive analytics and give up do so for the same reason: they expected the model to tell them something surprising. It almost never does. What it tells you is something you half-suspected, now backed by your own numbers and a track record you can defend to a sceptical partner or CFO.
The real value is not the insight. It is the permission to act on a hunch you could not justify before. A churn model that flags your three best customers as high-risk is not dramatic — but it is the difference between a proactive call this week and a cancellation email next month.
The second thing most guides understate: the operational integration is harder than the modelling. Getting a score into a spreadsheet takes days. Getting that score to automatically trigger a personalised email, update a CRM stage, and alert a sales rep — that is the work. Businesses that skip this step end up with impressive dashboards and unchanged results.
For Canadian small businesses specifically, the PIPEDA compliance layer adds a step most SaaS vendors gloss over. Consent logging and data-residency decisions need to happen before you connect your first data source, not after your first model is live.
The businesses pulling ahead are not the ones with the most sophisticated models. They are the ones that picked one question, built one model, connected it to one automated action, and measured it honestly.
What Tech Business Development offers for a managed pilot
Cutting CAC and recovering at-risk customers are the two fastest wins predictive analytics delivers — and Tech Business Development handles the full setup so you do not need a data scientist on staff.
A managed pilot with Tech Business Development covers GA4 and GTM configuration, CRM data connection, a 4–6 week model build, and a plain-language results dashboard showing conversion lift, CAC movement, and churn averted. The pilot is scoped to one use case so costs stay predictable and results are measurable within six weeks. Pricing is structured for small and local Canadian businesses, not enterprise budgets.
Ready to see what your existing data can predict? Book a pilot assessment with Tech Business Development and get a clear scope, timeline, and expected outputs before committing to anything.
Useful sources
- MIT — The power of prediction: predictive analytics, workplace complements, and business performance — Primary evidence for the 1–3% productivity gain and the workplace-complements condition (evidence and implementation sections).
- DOI review — Impact of predictive data modeling on business decision-making — Source for the 9–12% median KPI gain and governance artefact guidance (evidence, pitfalls, and roadmap sections).
- CDP.com — Predictive marketing and analytics: models, methods and CDPs — Explains unified customer profiles, real-time scoring, and incrementality testing (data requirements and metrics sections).
- Salesforce — Predictive marketing guide — Practitioner data on orders influenced growing over time with sustained use (evidence section).
- HubSpot — Predictive marketing: what it is and how to use it — Sprint churn case study and lead scoring examples (use cases section).
- Pecan.ai — Predictive analytics in marketing: a practical guide — Practitioner guidance on pilot design, LTV prediction, and churn modelling (roadmap and pitfalls sections).
- monday.com — Predictive analytics in marketing: 7 proven use cases — Practical use-case examples and experiment templates (use cases and metrics sections).
Recommended