Identify growth opportunities with data: a 2026 guide


Identifying growth opportunities with data is the process of analysing integrated business metrics to pinpoint insights that drive sustainable expansion. Growth teams that unified acquisition, behavioural, and revenue data in a single environment achieved a 50% relative lift in acquisition rates. That result is not a coincidence. It reflects what happens when businesses stop guessing and start reading the signals already inside their own systems. This guide gives small business owners and marketing professionals a practical framework for data-driven growth analysis, from preparing your data to embedding insights into weekly decisions.
How to identify growth opportunities with data
Data-driven growth analysis is the industry term for what most people call “using data to find growth.” The distinction matters because the industry term carries a specific methodology: you integrate multiple data streams, define trusted metrics, and run structured experiments. Identifying growth opportunities with data is not about collecting more numbers. It is about asking better questions of the numbers you already have.
78% of chief data officers consider proprietary internal data the primary source of competitive advantage. That means the data sitting in your CRM, your website analytics, and your payment processor is more valuable than any third-party market report. The challenge is connecting those sources and reading them together.
The three data streams that matter most are:
Most small businesses track each of these in isolation. Growth comes from reading them together.
What data preparation do you need before analysis?

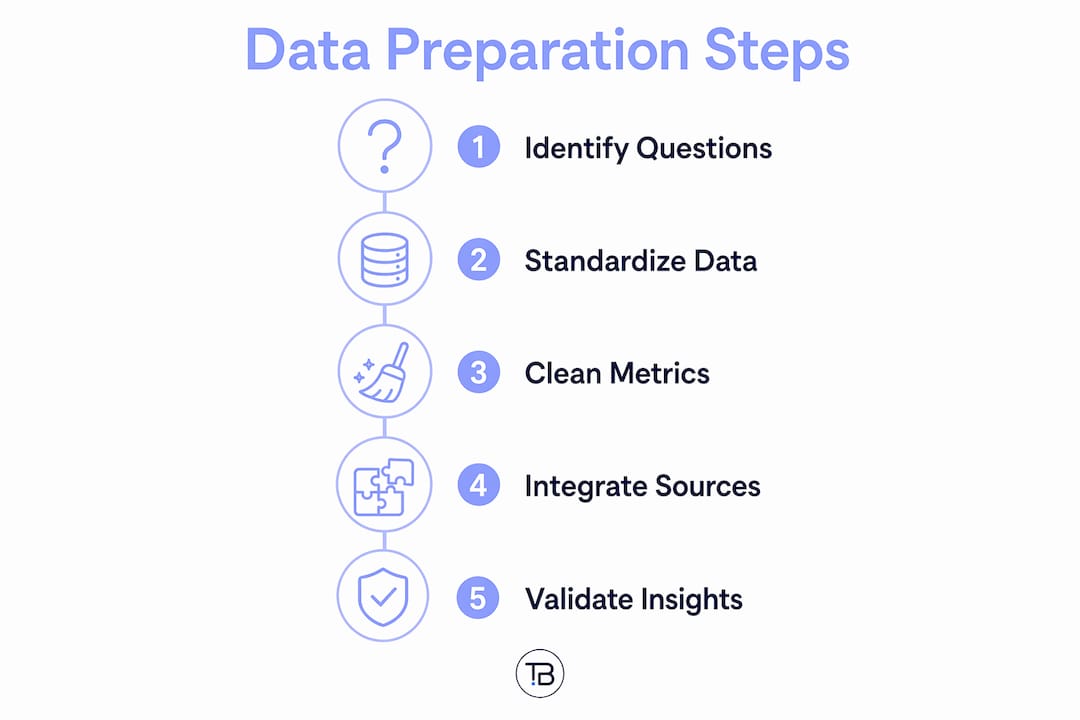
Raw data does not produce reliable insights. Before you run any analysis, you need to resolve two foundational problems: data quality and metric definitions.
Conflicting metric definitions across departments destroy trust in analytics and undermine AI-driven insights. If your sales team defines “active customer” differently than your marketing team, every report that uses that term will produce contradictory numbers. A semantic layer, which is a shared definition file that standardises terms like “revenue,” “active customer,” and “conversion,” creates a single source of truth across your entire organisation.
Data governance is not a large-company problem. A small business with three people pulling reports from different tools faces the same risk. The fix is simple: write down your metric definitions, agree on them as a team, and store them somewhere everyone can access.
Starting with 2–3 high-value business questions on trusted data produces faster results than building a comprehensive data platform from day one. Pick the questions that directly connect to revenue. “Which acquisition channel produces customers who stay the longest?” is a better starting question than “What does our full customer journey look like?”
Pro Tip: Before connecting any analytics tool, write down your top three business questions. Every metric you track should answer at least one of them. If it does not, cut it.
How does cohort analysis reveal hidden growth signals?
Cohort analysis is the single most powerful technique for finding growth signals that aggregate metrics hide. An aggregate metric tells you that your average customer stays for six months. A cohort analysis tells you that customers acquired through organic search stay for ten months, while customers acquired through paid social stay for three.
Transitioning from aggregate metrics to cohort-based thinking is the foundational shift that connects data to sustainable business growth decisions. That shift changes where you invest your budget.
The three metrics that cohort analysis makes meaningful are:
MetricWhat it measuresWhy it mattersLTV (lifetime value)Total revenue a customer generates over their relationship with youShows which segments are actually profitableCAC (customer acquisition cost)Total spend to acquire one customerReveals which channels are efficientPayback periodTime to recover CAC from a customer’s revenueFlags unsustainable spending before it compounds
Measuring the LTV to CAC ratio and monitoring payback period enables early detection of unsustainable growth spending. A business spending $200 to acquire a customer who generates $180 in lifetime revenue is not growing. It is shrinking with extra steps.
Funnel analysis complements cohort thinking by showing where customers drop off in a sequence. Funnel analysis highlights precise drop-off points that are critical for targeted growth interventions. If 60% of visitors add a product to their cart but only 20% complete the purchase, the growth opportunity is in the checkout flow, not in driving more traffic.
Pro Tip: Run your first cohort analysis by acquisition channel. Compare the 90-day retention rate for each channel. The channel with the highest retention rate deserves more budget, even if its volume is lower.
What tools can small businesses use to analyse growth data?
The analytics tool market divides into two broad categories: entry-level platforms suited to businesses with limited technical resources, and enterprise platforms built for data teams with engineering support. Small businesses do not need enterprise tools to get meaningful results.
Entry-level platforms typically offer pre-built dashboards, drag-and-drop report builders, and direct integrations with common tools like GA4, Shopify, and Stripe. They require no coding knowledge and can be set up in hours. The trade-off is limited flexibility when you need custom cohort analysis or cross-source data joins.
Enterprise platforms offer full SQL access, custom data modelling, and the ability to join any data source. They require a data analyst or engineer to operate effectively. The cost is higher, and the setup time is measured in weeks, not hours.
The more important shift in 2026 is not which platform you choose. It is whether you use AI-assisted analytics at all. Agentic AI enables always-on analytics by automating data acquisition and cleansing, and by alerting teams to emerging anomalies in real time. That means you do not need to check a dashboard every morning. The system flags when something changes.
Key capabilities to look for in any analytics tool:
Automating competitor analysis reporting is one practical application of AI agents that complements internal growth analytics. Knowing when your market shifts is as useful as knowing when your own metrics shift.
How do you embed data insights into business decisions?
Data that sits in a dashboard does not drive growth. Data that gets reviewed in a structured weekly rhythm does.
High-performing growth teams focus on analytical speed over reporting frequency, using a weekly rhythm to allocate budget and iterate on experiments. That cadence compresses the time between forming a hypothesis and validating it from months to weeks. A weekly growth review covers three things: which metrics moved, which experiments produced results, and where budget shifts for the coming week.
The most common mistake is measuring whether a tool was implemented rather than whether it changed behaviour. Data literacy, leadership support, and incentive structures are as critical as the technology itself for realising growth from analytics. If your team does not trust the numbers, they will not act on them.
Three practical steps to embed analytics into decisions:
CRM workflow automations can trigger actions based on the data signals your analytics surface, closing the gap between insight and execution automatically.
Pro Tip: Block 60 minutes every Monday for a growth review. Review three metrics, one experiment result, and one budget decision. Consistency matters more than the length of the meeting.
Key takeaways
Using data to find growth requires integrating acquisition, behavioural, and revenue data into a shared framework with clear metric definitions, cohort-based analysis, and a weekly decision rhythm.
PointDetailsIntegrate three data streamsCombine acquisition, behavioural, and revenue data to reveal unit economics that isolated reports miss. Define metrics before analysing A shared semantic layer prevents conflicting definitions from undermining trust in your reports.Use cohort analysis over averagesCohort thinking reveals which customer segments are profitable and which channels produce lasting growth.Start with 2–3 questionsFocused analysis on trusted data produces faster results than building a comprehensive platform first.Build a weekly review rhythmHigh-performing teams allocate budget and validate experiments on a weekly cadence, not a quarterly one.
What I have learned about data and growth after years in the field
The conversation about data and growth has shifted considerably. A few years ago, the focus was on growth hacking: rapid, often disconnected tactics designed to spike a metric. The problem was that spikes rarely held. The businesses that sustained growth were the ones that built analytical rigour into their operations, not just their campaigns.
The finding that trust is the top concern in AI adoption, cited nearly twice as often as any other barrier, does not surprise me. I have seen teams invest in sophisticated analytics platforms and then ignore the outputs because nobody agreed on what the numbers meant. The technology was not the problem. The governance was.
What actually works is narrower than most people expect. Pick one growth lever, define the metrics around it clearly, and measure it honestly for 90 days. The businesses that do this consistently outperform the ones chasing every new tool or tactic. Intensive use of customer analytics increases the likelihood of outperforming competitors by over 20 times on acquisition and profitability. That is not a marginal advantage. It is a structural one.
The advice I give most often is this: do not wait until your data is perfect. Start with the cleanest data you have, answer one meaningful question, and build from there. Perfection is the enemy of progress in analytics, just as it is everywhere else.
How Tech business development helps you act on your data
Knowing what your data says is one thing. Building the systems that act on it automatically is another. Tech business development specialises in connecting analytics to operations, so the insights your data surfaces translate directly into business outcomes without adding to your team’s workload.

From GA4 and GTM setup to AI-assisted workflow automation, Tech business development handles the technical layer so you can focus on decisions, not dashboards. The team works with small businesses across marketing, logistics, and technology to build data workflows that cut manual tasks and reduce operational costs. Explore the full range of IT and automation services or review transparent pricing to find the right fit for your business.
FAQ
What does it mean to identify growth opportunities with data?
Identifying growth opportunities with data means analysing integrated business metrics, including acquisition, behavioural, and revenue data, to find specific, actionable areas where investment will produce measurable growth.
Why is cohort analysis better than looking at averages?
Cohort analysis groups customers by shared characteristics, such as acquisition channel or sign-up month, revealing which segments are profitable. Averages hide the differences between high-value and low-value customer groups.
How many data sources do I need to start?
Start with two or three trusted data sources that directly connect to revenue. Adding more sources before your core metrics are reliable creates noise, not clarity.
What is a semantic layer and why does it matter?
A semantic layer is a shared definition file that standardises metric names like “revenue” and “active customer” across your organisation. It prevents conflicting reports and builds trust in analytics outputs.
How often should a small business review its growth data?
A weekly review rhythm is the standard for high-performing growth teams. It compresses the time between forming a hypothesis and validating an experiment from months to weeks.
Recommended