Beat 6.6%: 2026 Landing Page Conversion Rate Benchmarks and 4 Step Fix


Across industries, landing pages convert at roughly 6.6% on average, while the top quartile of dedicated pages converts notably higher. If your page sits below that range, the fix usually starts with faster load times and shorter forms, not a full redesign. Before chasing any number, measure your own baseline by channel. That figure, not an industry average, is the one that should guide your next test.
TL;DR:
- Most landing pages convert at around 6.6%, but top-performing pages can reach 11.45% or higher, which is roughly three times better.
- Accurate measurement of conversions requires tracking unique visitors, verifying thank-you page loads, and avoiding double-counting or broken redirects.
- Buffer benchmarks should be personalized: if your last two quarters show a 3.8% conversion rate, setting a realistic goal of 5% is more effective than aiming at industry averages.
- Improving load speed, simplifying forms to five or fewer fields, and ensuring message match are among the most impactful tactics for increasing conversions.
- Prioritize testing hypotheses with clear KPIs, use segmented data, and focus on downstream lead quality to avoid vanity metrics and achieve sustainable growth.
Table of Contents
- How do you calculate landing page conversion rate?
- What is the average landing page conversion rate right now?
- How do conversion rates vary by industry and channel?
- Which landing page tactics actually move conversion rates?
- How should you structure A/B tests for landing pages?
- What tools do you need to measure conversions reliably?
- What mistakes distort conversion rate decisions?
- How Tech Business Development applies the audit-test-implement loop
- What should you tackle first this year?
- Get your landing pages audited and fixed
- Sources
How do you calculate landing page conversion rate?
The formula looks simple: conversions divided by total visitors, multiplied by 100. In practice, most teams get this number wrong before they ever run a test.
The first mistake is counting sessions instead of unique users, which inflates the denominator when visitors return multiple times before converting. The second is double-counting conversions, usually because a thank-you page fires a tag on refresh or back-button navigation, quietly padding your numerator. The third, and most common, is never verifying that the thank-you page actually loads for every legitimate submission. A broken redirect can silently erase 10 to 15% of real conversions from your reporting without anyone noticing for weeks.
Conversion rate alone tells you almost nothing about what to fix. You need supporting metrics that point to where visitors drop off:
- Bounce rate — how many visitors leave without any interaction, often a signal of poor message match between the ad and the page.
- Form abandonment rate — the percentage of visitors who start a form but never submit it, which usually points to friction, not disinterest.
- Cost per conversion — your ad spend divided by conversions, the number that ties landing page performance directly to budget efficiency.
- Lead-to-opportunity rate — what percentage of form fills your sales team actually accepts as qualified, a check against optimising for volume alone.
- Time-to-first-response — how quickly a sales rep follows up, which affects whether a “conversion” ever becomes revenue.
Getting reliable numbers on all five requires a measurement setup, not guesswork. Tag every campaign with consistent UTM parameters so channel-level comparisons hold up. Build your GA4 conversion tracking around a clear event model rather than firing generic pageview goals. Wire Google Tag Manager carefully, checking for duplicate tags that double-fire on the same action. Route qualified leads into your CRM automatically so sales feedback flows back into your reporting, closing the loop between marketing and pipeline.
What is the average landing page conversion rate right now?
Unbounce’s analysis of 41,000 landing pages, covering 464 million visitors and 57 million conversions, put the average conversion rate at about 6.6%. That single number gets quoted everywhere, but it hides more than it reveals.
Other datasets tell a more layered story. LanderLab’s 2026 benchmark compilation puts the median dedicated landing page closer to 4%, with the top 25% of pages reaching 11.45% or higher. That gap between median and top quartile is the real story: the difference between an average page and a genuinely optimised one is roughly triple the conversion rate, not a marginal improvement.
Blended averages mislead for a simple reason. HubSpot’s research warns against treating any single benchmark as universal, because conversion rate depends heavily on offer type, traffic source, and page intent. A free ebook download and a $50,000 enterprise software demo request are never going to convert at comparable rates, no matter how well-built the pages are.
By the numbers: The typical landing page converts around 6.6% of visitors, but top-quartile pages convert at a notably higher rate, according to LanderLab’s benchmark data. That’s roughly a threefold gap between average and excellent.
A few factors explain most of the spread you’ll see across pages:
- Offer commitment level — low-friction offers (newsletter signups, free trials) convert far higher than high-commitment asks (demo requests, sales calls).
- Traffic intent — visitors arriving from a branded search convert differently than those clicking a cold social ad.
- Page purpose — a page built for one specific campaign consistently outperforms a general-purpose page trying to serve multiple audiences.
- Industry norms — regulatory friction, average deal size, and buying cycle length all shift what “good” looks like sector by sector.
The practical move is to treat 6.6% as a rough floor and 11%+ as a stretch goal, then anchor your real target to your own historical baseline. If your best-performing page over the last two quarters converted at 3.8%, a realistic near-term goal is 5%, not an arbitrary industry median pulled from a report that never saw your offer, your audience, or your price point.
How do conversion rates vary by industry and channel?
Industry context changes what counts as strong performance more than almost any other variable. A few directional patterns hold up across most benchmark studies, with the usual caveat that sample sizes and definitions differ between reports:
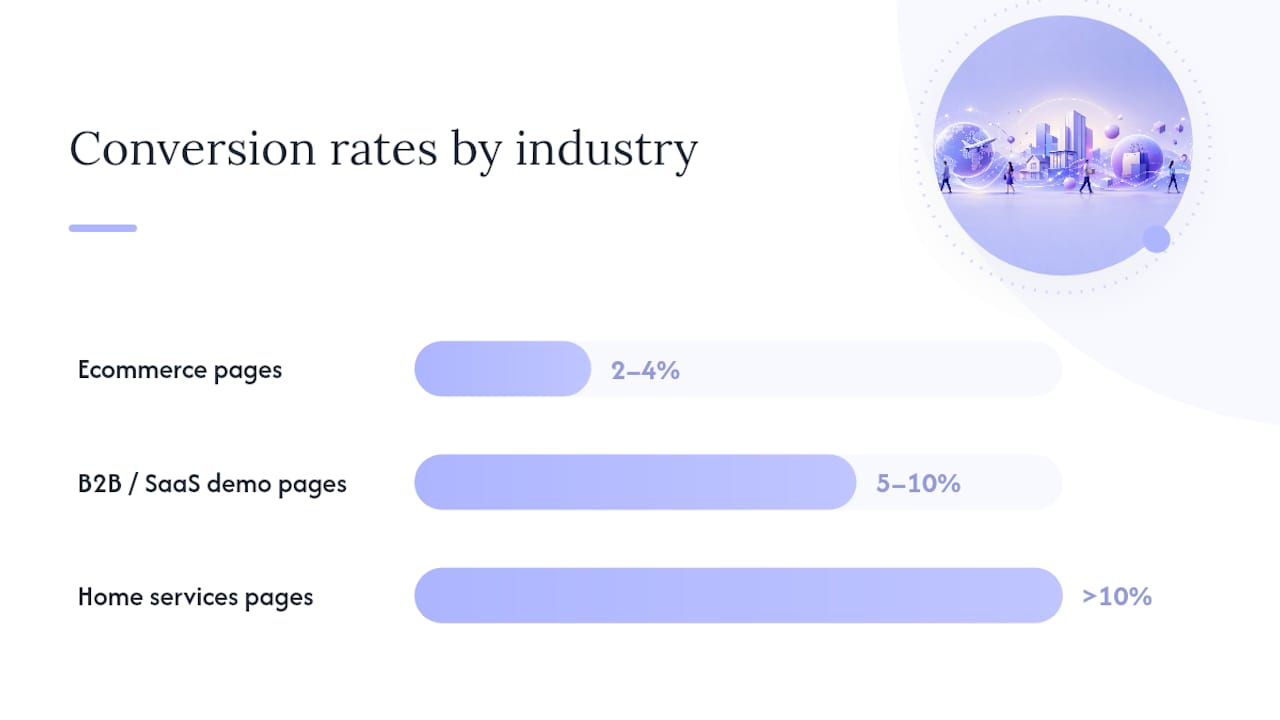
- Ecommerce pages, especially product-specific landing pages tied to a single SKU or promotion, tend to sit in the low single digits, often 2% to 4%, because purchase intent varies wildly by traffic source.
- B2B and SaaS demo or trial pages often land higher, frequently 5% to 10%, particularly when the offer is a free trial rather than a sales call.
- Home services pages (roofing, HVAC, plumbing) can post some of the highest rates, sometimes exceeding 10%, because local intent and urgency are usually already established before the click.
- Finance pages, quote requests and application starts especially, tend to run lower due to regulatory friction and multi-step forms.
- Healthcare appointment and consultation pages vary enormously depending on whether the visitor is comparison-shopping or already committed to booking.
Channel matters just as much as industry, sometimes more. Paid search traffic generally converts higher than paid social, because search visitors are actively looking for a solution while social visitors are often interrupted mid-scroll. Email traffic tends to convert well when the list is warm and the landing page continues the exact message from the email subject line. Organic traffic sits somewhere in between, heavily dependent on how well the page matches the search query that brought the visitor there.
Message match explains a large share of this channel variation. When your ad headline, your email subject line, and your landing page headline all say the same thing in the same words, visitors don’t have to work to confirm they’re in the right place. Break that continuity, and even qualified traffic bounces.
To make sensible comparisons in your own analytics, segment every report by channel and by campaign intent before you draw conclusions. Comparing a cold paid social campaign’s conversion rate against a warm email campaign’s rate, without separating the two, produces a blended number that tells you nothing actionable. Build separate benchmarks for each channel and each offer type, then track trends within those segments over time rather than against the industry at large.
Which landing page tactics actually move conversion rates?
Not every tactic delivers the same return. Ranked roughly by expected impact based on the weight of evidence across testing platforms, these are the changes worth tackling first.
-
Fix message match before anything else. If your ad promises “free consultation” and your headline says “book a demo,” you’ve already lost a chunk of visitors before they read a second line. Rewrite headlines to mirror the exact language that brought people to the page.
-
Cut form fields aggressively. Discovered Labs’ compilation of form experiments found that dropping from four fields to three produced roughly a 50% lift in conversions in some tests. Forms with five fields or fewer consistently outperform longer ones. If you need more information for lead qualification, use progressive profiling: ask for name and email up front, then collect the rest on a follow-up page or through a CRM workflow after the fact.
-
Treat page speed as a conversion lever, not a technical nice-to-have. Shopify’s optimisation research shows pages that load in around one second convert substantially better than those taking five seconds or longer, with some analyses citing uplifts of two to three times. Largest Contentful Paint reductions are often the single highest-return experiment a team can run, even when they require real engineering time.
-
Put outcome-specific social proof above the fold. Generic testimonials (“Great service!”) do almost nothing. A testimonial that names a specific result, a percentage improvement, a dollar figure, a timeframe, does far more work. Logo strips of recognisable clients help too, but only when they’re relevant to the visitor’s industry.
-
Strip the page down to one goal. Remove the main navigation, footer links, and any competing calls to action. Every additional exit point on a landing page is a leak in your funnel. If you’re deciding between a single-purpose page and a broader multi-page site experience, the tradeoffs between one-page and multipage structures are worth understanding before you build.
-
Personalize for your highest-value segments. Dynamic headlines or hero images that shift based on the referring campaign or audience segment tend to outperform static, one-size-fits-all pages, especially for enterprise or high-ticket offers where the buyer expects relevance.
Crafting an offer and CTA that genuinely resonates with a specific audience segment is its own discipline, and proven lead generation approaches from agencies working this problem daily offer useful patterns worth borrowing.
Pro Tip: Before testing any visual redesign, test your headline alone. Headline-only experiments are cheap to run, fast to read, and frequently produce double-digit lifts, making them the best return on testing time for teams with limited traffic.

How should you structure A/B tests for landing pages?
A test without a hypothesis is just a guess with extra steps. Every experiment should start with a specific, measurable claim, not a vague “let’s see if this works better.”
-
Write the hypothesis in one sentence tied to a business metric. For example: “Reducing the form from six fields to three will increase form completion rate by at least 15% without reducing lead-to-opportunity rate.” Name a primary KPI and one or two secondary KPIs before you launch anything.
-
Prioritize using an ICE framework. Score each potential test on Impact, Confidence, and Ease, then run the highest-scoring tests first. A headline change might score high on all three; a full page rebuild might score high on impact but low on ease, meaning it gets scheduled, not skipped, once resources allow. ExperimentFlow’s testing playbook walks through this kind of prioritisation in more depth.
-
Calculate the sample size before launching, not after. Running a test with too little traffic produces noise dressed up as a result. Use a standard significance level of 95% and don’t call a winner until you’ve hit your calculated minimum sample on both variants.
-
Control for seasonality. Never compare a test that ran through a holiday week against a baseline from a normal month. Run tests for full weekly cycles at minimum to average out day-of-week effects.
-
Check downstream quality before declaring victory. A form-shortening test that lifts conversion rate by 20% but drops lead-to-opportunity rate by 30% hasn’t actually won anything. Wait for enough leads to move through your sales pipeline before locking in the change permanently.
Teams that build this cadence into a routine, rather than testing sporadically, tend to see gains compound over time rather than plateau after the first easy win.
What tools do you need to measure conversions reliably?
Getting trustworthy data requires the right tools wired correctly, not just more tools. A handful of components make up a dependable measurement stack:
- GA4 conversion events configured around the specific actions that matter (form submit, calendar booking, phone click), not generic pageviews. Our GA4 conversion tracking guide covers the setup details.
- Google Tag Manager, checked regularly for duplicate tags that fire twice on the same event and quietly inflate your numbers.
- Ad platform pixels, paired with server-side tagging where possible, since browser-based tracking alone is increasingly unreliable due to privacy restrictions and ad blockers. Our Google Ads conversion tracking guide walks through the setup.
- CRM integration with deduplication, so the same lead doesn’t get counted twice and so you can track movement from sales-accepted lead to sales-qualified lead.
- ROI signals, specifically return on ad spend, cost per conversion, and revenue per lead, tracked alongside raw conversion rate so volume gains never get mistaken for revenue gains.
What mistakes distort conversion rate decisions?
Several common habits quietly sabotage otherwise sound optimisation work:
- Optimising purely for volume. More form fills mean nothing if lead quality drops, since practitioner guidance consistently warns that unqualified leads waste sales time without adding revenue.
- Miswired events. Duplicate conversion tags or broken thank-you page redirects can overstate or understate your real numbers by double digits.
- Overfitting to industry averages. Chasing a generic benchmark instead of your own segment’s baseline leads to arbitrary targets.
- Ignoring mobile performance. A page that converts well on desktop can quietly underperform on mobile if load times or form usability weren’t tested separately.
How Tech Business Development applies the audit-test-implement loop
Landing page performance rarely improves through one big fix. It improves through a repeatable loop: audit the current setup, run targeted tests, implement what wins, then measure the downstream effect on lead quality and revenue.
Some consultancies build that loop into client engagements through a few consistent steps:
- Audit existing GA4, GTM, and CRM wiring to find miswired events and gaps in tracking before touching page design.
- Test message match, form length, and page speed in a prioritised sequence rather than all at once.
- Implement winning changes alongside broader Google Ads, GA4, and website updates so the fixes hold across the whole funnel.
- Measure results against lead quality, not just raw conversion percentage, feeding CRM data back into the next round of tests.
A typical case follows a simple template: baseline conversion rate measured over a full quarter, two to three tests run in sequence (usually form length and headline first), a technical fix (often page speed), and a measured result tied to lead-to-opportunity movement rather than conversion rate alone. The analytics best practices guide covers how to structure this kind of reporting internally.
What should you tackle first this year?
If you’re deciding where to spend limited time and budget this year, start with three things: measure your actual baseline by channel before setting any target, fix page speed and form length before touching design, and run one clean headline test before anything more ambitious. Those three moves cost the least and tend to return the most.
Budget trade-offs come down to one question: does the fix require engineering time? Page speed usually does, which means it competes for a developer’s calendar. Form length and headline changes usually don’t, which means marketing can move on them immediately without waiting in a backlog.
My honest view on the volume-versus-quality debate: chasing a higher conversion rate while ignoring lead quality is optimising the wrong metric entirely. A page that converts at 3% with strong lead quality will outearn a page converting at 8% with garbage leads, every time revenue gets tallied at the end of the quarter.
— Shayan Shirvani
Get your landing pages audited and fixed
Most of the fixes covered here, form length, page speed, message match, proper GA4 event wiring, sound simple until you’re the one untangling six months of miswired tags and a CRM that’s never talked to your ad platform. Some providers handle that untangling directly: a full audit of GA4, GTM, and CRM setup, hands-on landing page optimisation, and Google Ads and AdWords configuration done as one connected project instead of five disconnected vendors.
A typical engagement starts with an audit of your current tracking and page performance, moves into a prioritised round of testing on the highest-impact levers first, and ends with the winning changes implemented across your funnel, not just on one page. Clients get a clear read on what their real baseline conversion rate is, what’s realistic to target, and which fixes are worth engineering time versus which aren’t. If your landing pages haven’t been properly measured in the last quarter, that’s the place to start. Visit Tech Business Development to book an audit and find out where your funnel is actually losing leads.
Sources
- What is the average landing page conversion rate? (Q4 2024 data) - Unbounce
- Landing page optimization: a data-driven framework - Discovered Labs
Recommended